ZONPY

Tidal Zoning for Hydrographic Surveys

ZONPY builds the extra tide curves your survey needs between two gauges — a reference station and a subordinate one — following the NORMAM 501 methodology used by the Brazilian Navy's Hydrographic Center (CHM).

Try it Free → See how it works
Purpose

One reference gauge, one subordinate, N zones in between

Surveys rarely happen right next to a tide gauge. ZONPY closes that gap: it takes the observed record from a reference station — always the most seaward of the two — and a subordinate station further inside the estuary, and interpolates as many intermediate tidal zones as the survey area requires.

Time-correction and range-ratio factors are derived from the correlation between the two stations, then propagated in time and space to build a synthetic tide curve for every zone — structured around the technical requirements of NORMAM 501.
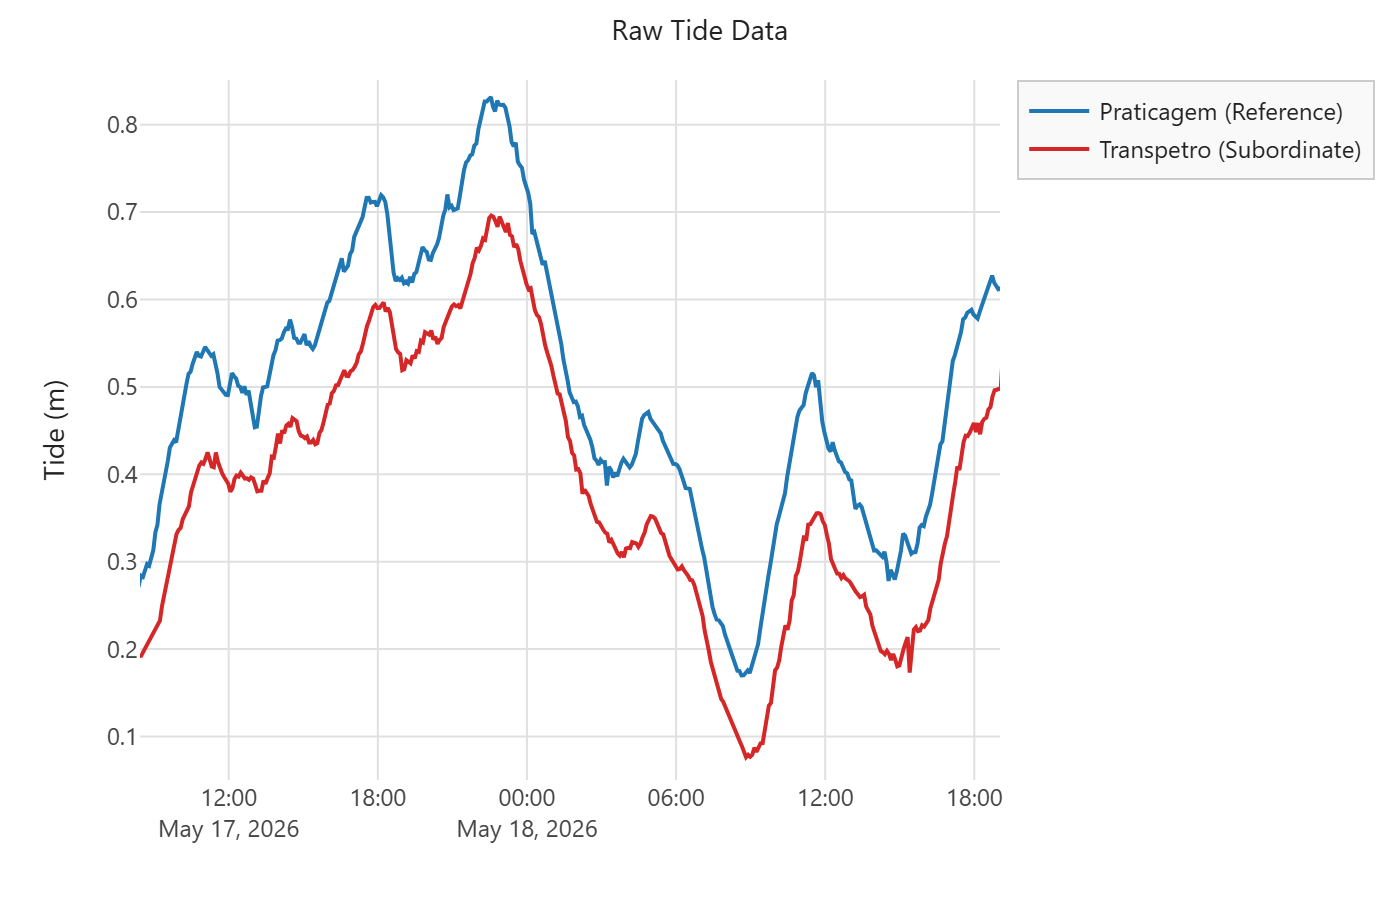
Raw tide records from two stations
Raw tide records from a reference and a subordinate station — the starting point of every zoning run.
A guided, seven-step workflow

Each step previews its result before you accept it and move on to the next one — nothing is a black box.

Outlier removal

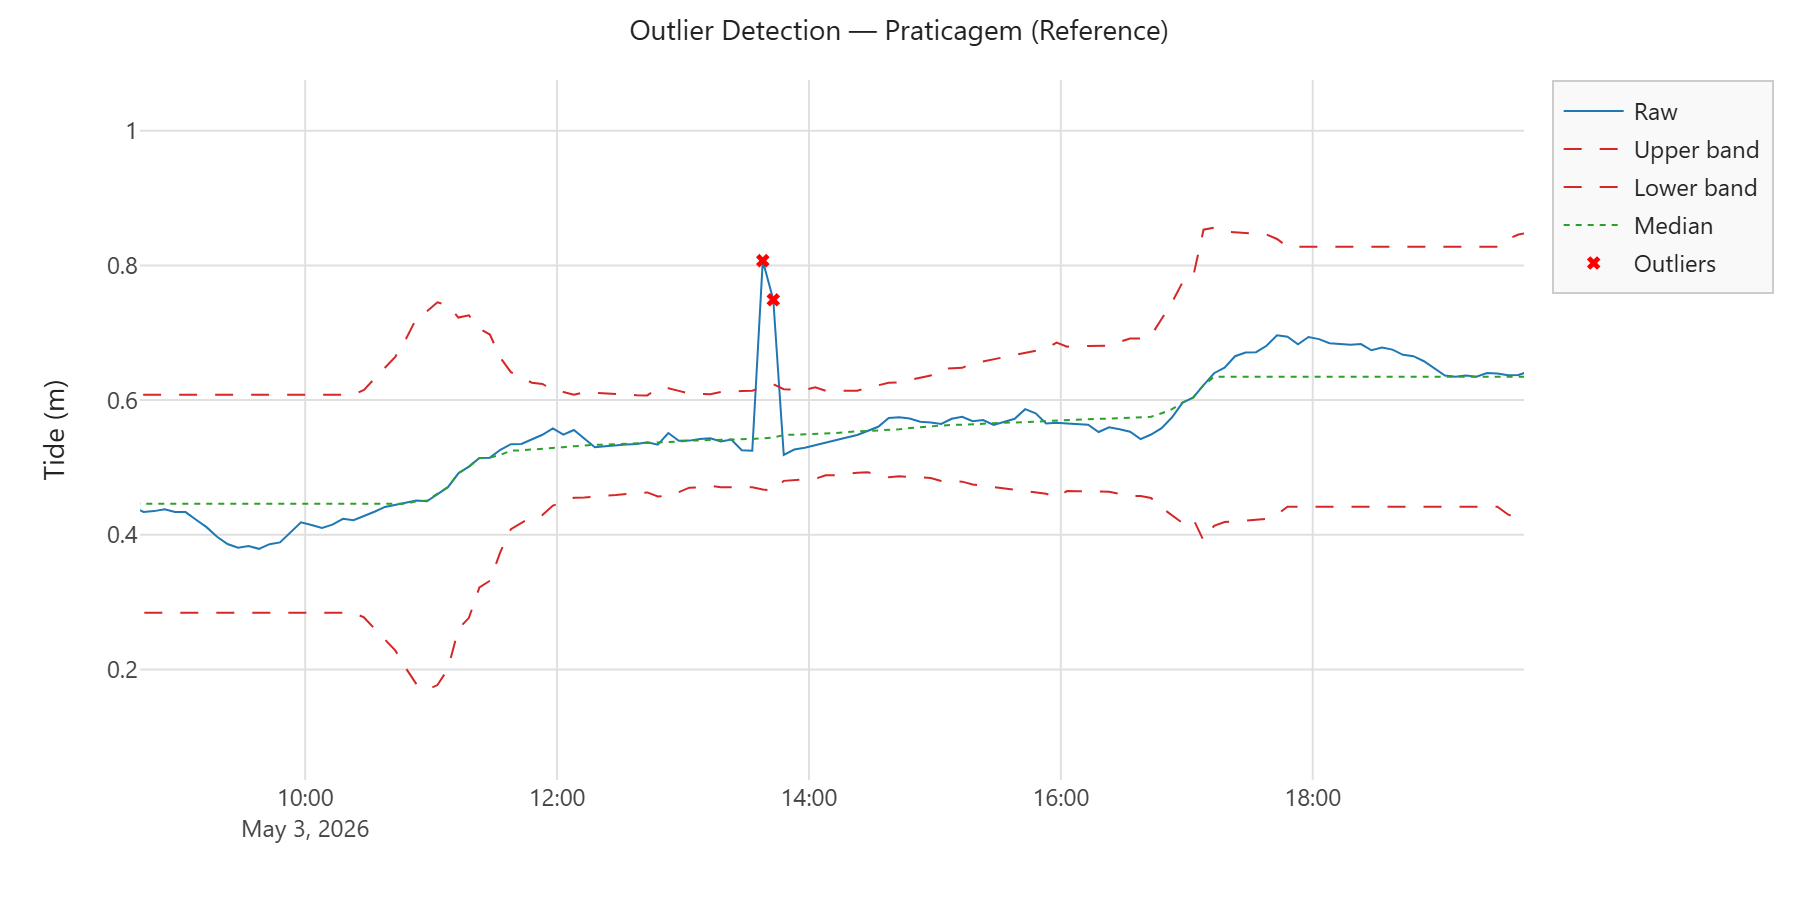
A Hampel filter over a sliding median window flags spikes and gaps in the raw record before anything else touches the data. A gradient filter can be switched on for stretches that need it.

Outlier detection on a tide station
Outlier detection on the reference station — median band and flagged spikes, before you decide what to remove.

Phase lag detection

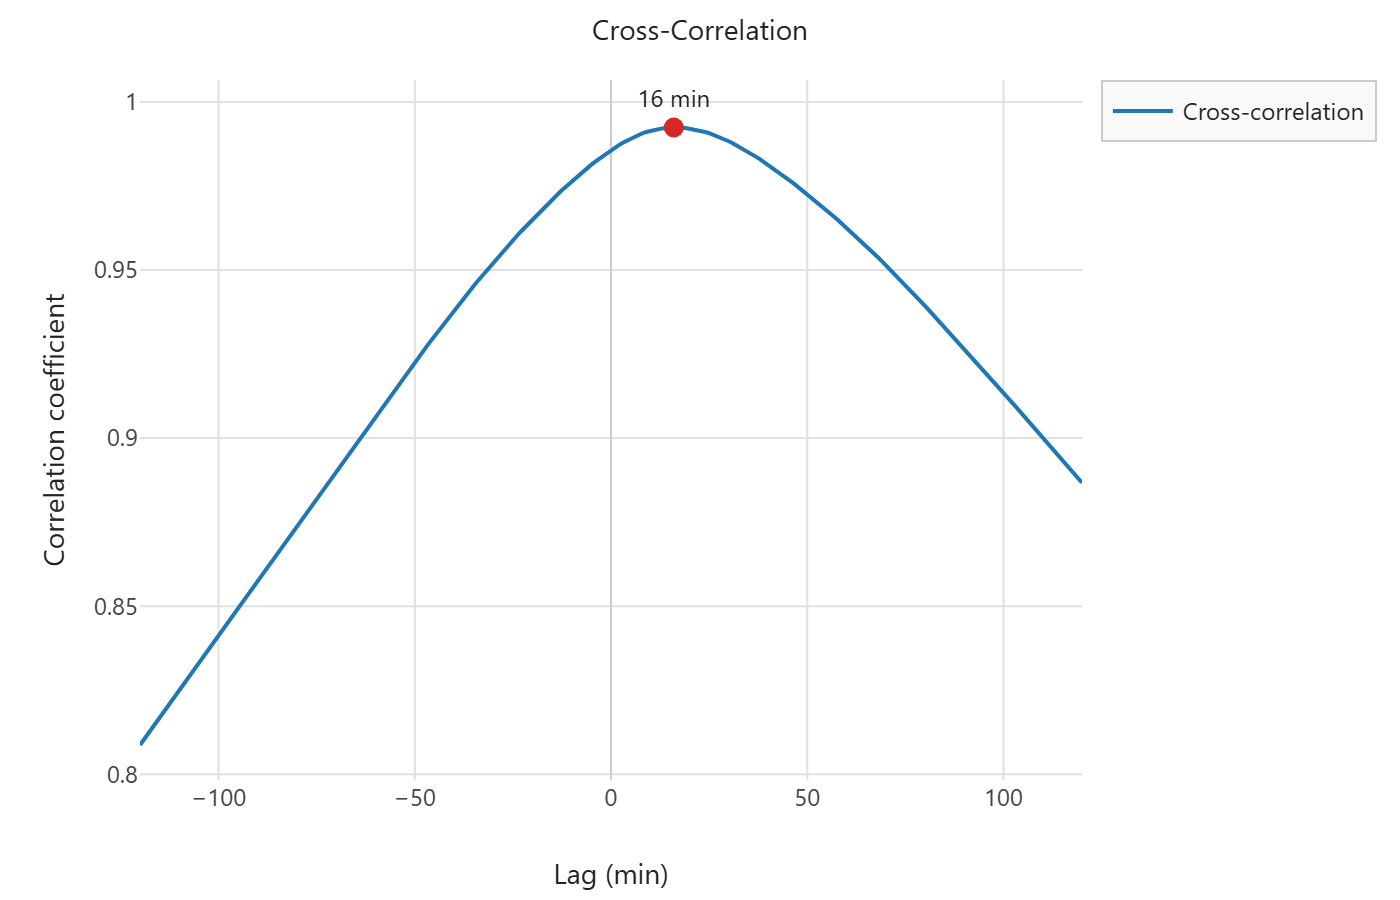
After filtering and resampling to one-minute steps, ZONPY cross-correlates the two stations to find the time lag between them. A positive lag means the reference station leads, as expected for a station further out in the estuary; a negative lag points to a likely station inversion, which ZONPY flags and corrects for automatically.

Cross-correlation between two tide stations
Cross-correlation peak — the time lag between reference and subordinate station.
Output

From two gauges to a full zoning table

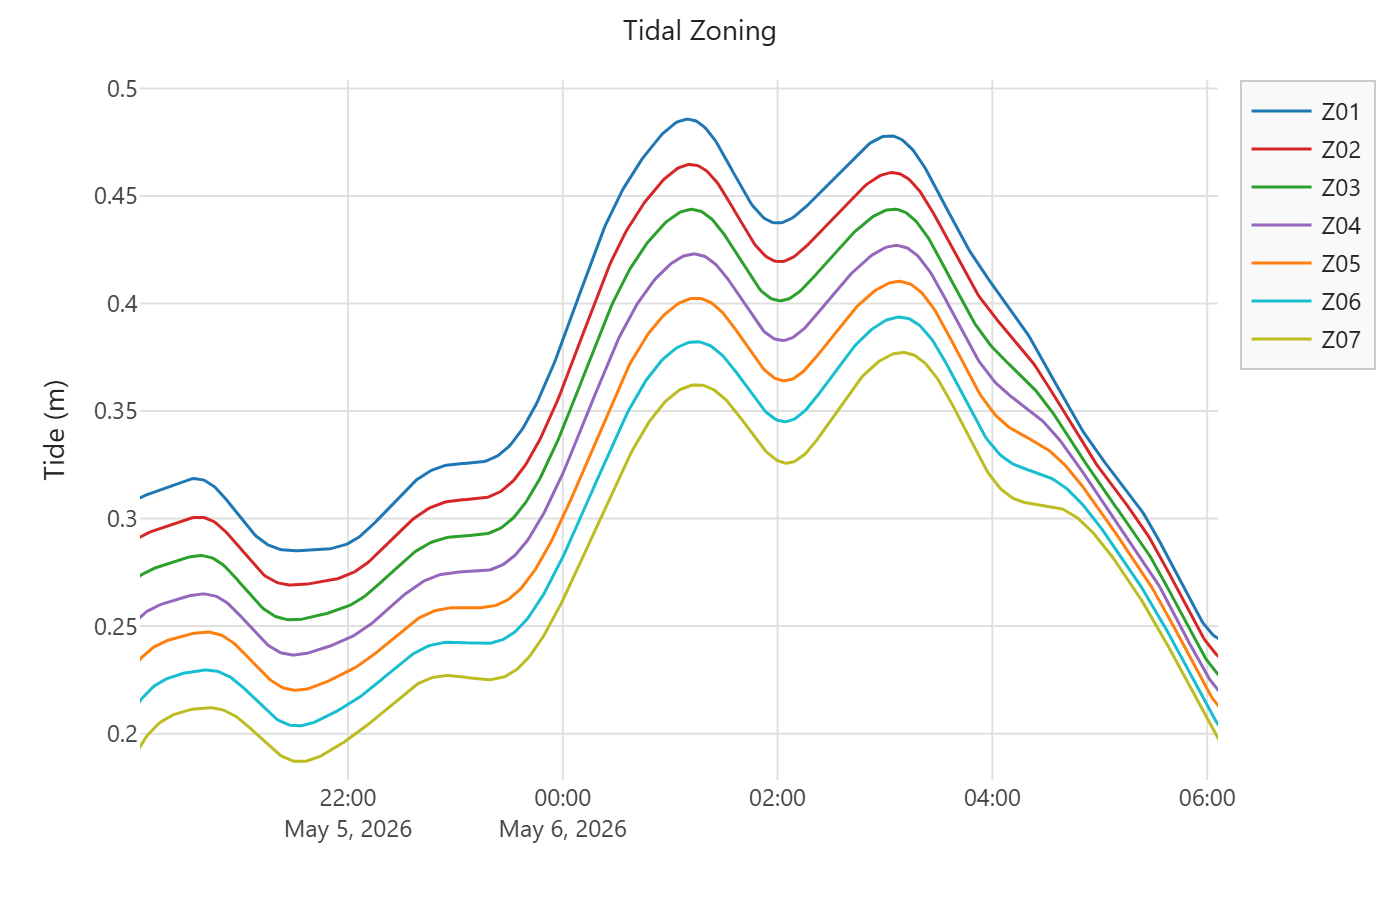
The last step interpolates N synthetic tide curves between the two stations, each with its own computed Zo (tidal semi-amplitude) relative to its datum. The result is a zoning table plus one exported file per zone, ready to drop straight into your survey software.

Interpolated tidal zoning curves
Seven interpolated zones (Z01–Z07) between reference and subordinate station.

Import once, export everywhere

Feed ZONPY a plain text tide record and export directly into the format your acquisition/processing software expects.

FormatExtensionSoftwareTimestamp
CARIS.tidCARIS HIPS & SIPSYYYY/MM/DD HH:MM:SS
HYPACK.tdxHYPACKHH:MM MM/DD/YYYY
Plain text.txtgenericYYYY MM DD hh mm 00
Excel.csvExcelISO datetime

CARIS® and HYPACK® are registered trademarks of their respective owners. Mentioned here solely to indicate file-format compatibility.

Ready to zone your next survey?

Free to try — no installation, runs entirely in your browser.

Try it Free →